A Data-Driven Framework for Choosing Your Next ABA Clinic Location
Using Clinivise’s public workforce and hiring data to evaluate where — and whether — to open a clinic in Indiana.
I recently ran across a new set of public-facing datasets from Clinivise — certificant counts, county-level growth, job demand, wage distributions, and local provider saturation. It’s the first time I’ve seen this much ABA workforce and market structure data pulled together in one place and refreshed frequently.
Seeing it all in one place got me thinking:
If I were a COO, VP of Growth, or PE-backed operator today, how would I use this data to make a real decision about where to open my next clinic?
Historically, most of us made these decisions using some mix of gut feel, Google searches, ChatGPT prompts, and a few trusted industry experts. For years, the closest thing the field had to a workforce map was the BACB Certificant Data PDF — a quarterly snapshot showing total BCBAs and RBTs by state.
- Helpful for direction, but limited: no county detail, no job demand, no wage data, no saturation metrics, and no way to drill down locally.
For me, the goal is always the same: increase access to care, but do it in a way that providers can actually sustain — operationally, financially, and clinically. Good data doesn’t just help organizations grow; it helps them grow responsibly and avoid decisions that ultimately reduce access.
With Clinivise now exposing workforce, density, and hiring data in a more granular and frequently refreshed format, the analysis becomes more structured — less vibes-based, more evidence-based.
To make this concrete (and not just another theoretical framework), I decided to walk through how I’d evaluate a potential new market using real data Clinivise exposes today, nothing proprietary.
I chose Indiana because it’s a state with strong certificant density, rising job demand, tightening payor conditions, and meaningful county-level variation — the kind of market where data can make the difference between a successful launch and a costly mistake.
Step 1 — Start with Workforce Supply
(Clinivise: Total Certificants + Growth)
Before you look at payors or referrals, you look at people.
Can this state supply the clinicians you need?
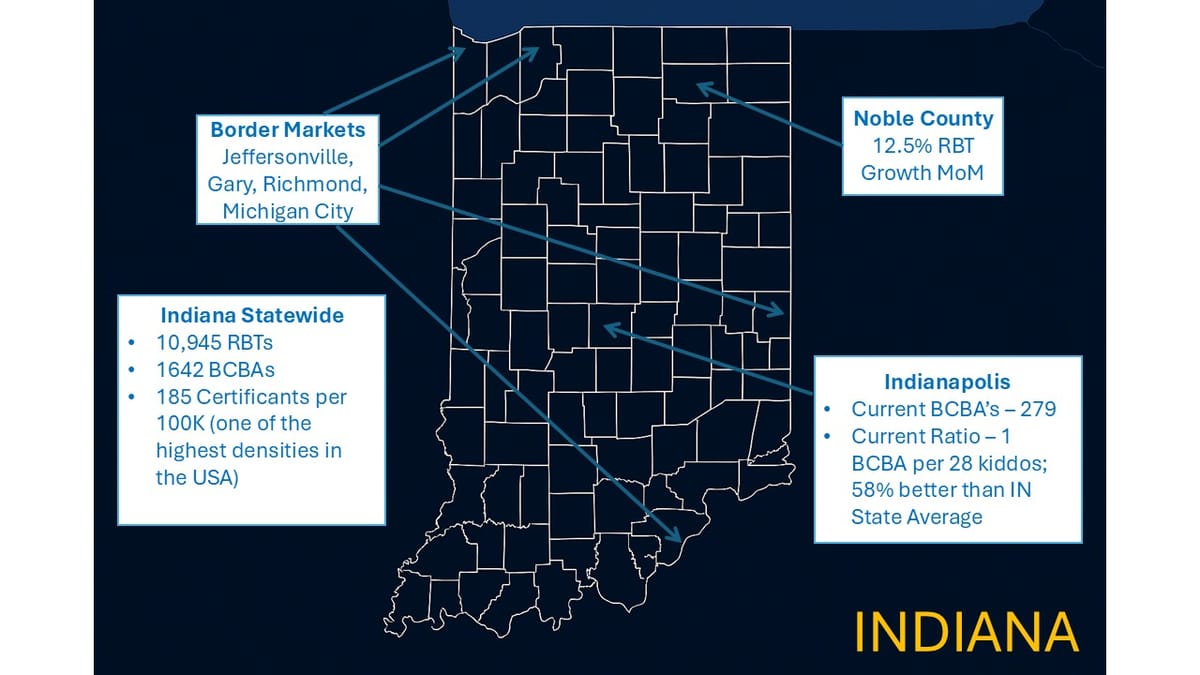
Clinivise shows Indiana’s current workforce roughly as:
- 10,945 RBTs
- ~2,000 BCBAs/BCBA-Ds combined
- RBT:BCBA ratio of ~5.5–6:1 (vs. ~3:1 nationally)
- ~13,000 certificants total
- 185.4 certificants per 100k — one of the highest densities in the country
The immediate operator takeaway:
Indiana has plenty of RBTs, but supervisory capacity is tight.
If my model depends on dense caseloads and consistent BCBA supervision, this ratio tells me:
- Start BCBA recruiting early
- Expect supervisory competition in metro areas
- Consider hybrid/remote supervision
- Don’t assume “Indiana is easy to staff” — that used to be true, but not anymore
Questions I’d ask here:
- Can this state support year 1 and year 2 staffing targets?
- Are RBTs growing faster than BCBAs?
- Can this market support multi-site growth, not just one clinic?
Step 2 — Go County-Level: Where Is Workforce Momentum Shifting?
(Clinivise: Top Growing Counties + County Rankings)
State-level data is too blunt.
County-level data shows where competition may emerge.
Indiana’s Noble County stands out:
- +10.7% certificant growth last month
- +12.5% RBT growth
These growth pockets often signal:
- New providers entering
- Wage shifts emerging
- Training pipelines producing fresh candidates
- Competition tightening
If I’m evaluating Fort Wayne, Noble County’s spike tells me:
Expect tightening recruitment pressure northeast of the metro.
Step 3 — Evaluate Job Demand & Hiring Pressure
(Clinivise: Job Market Analytics + Top Hiring States)
Supply tells you can we staff?
Demand tells you how hard staffing will actually be.
Indiana posted:
- 547 ABA job openings in the last 90 days
- Higher job volume than some larger states (WA, OR, AL)
- A very high concentration of RBT postings relative to population
Operator interpretation:
Indiana is a strong supply market, but a competitive hiring market.
If I open a clinic in Indiana, I should anticipate:
- Faster interview turnaround
- Structured cohort onboarding
- Possibly hiring bonuses
- Tight competition for supervisors
Clinivise lets you see this before choosing a ZIP code.
Every expansion decision has downstream access implications. When staffing pressure is underestimated — especially BCBA supervisory constraints — clinics open under-resourced, families wait longer, and turnover accelerates. Opening in the right place with the right staffing assumptions increases access without straining the workforce that delivers it.
Step 4 — Border Market Dynamics
Indiana’s borders offer major opportunities — and major risks — depending on your staffing strategy.
Here are some markets operators often overlook:
Jeffersonville (IN) & Louisville (KY)
The Southern Indiana/Louisville corridor behaves like one labor market.
BCBAs and RBTs move freely across the river.
Wages in Louisville can pressure Indiana clinics quickly.
Gary (IN) & Chicago Suburbs (IL)
Gary behaves like part of the greater Chicagoland labor market.
Competition, wages, and candidate flows are Chicago-driven.
Michigan City (IN)
Close enough to both Michigan and the Northwest Indiana / Chicago halo that wage dynamics blend across borders.
Richmond (IN) & Dayton (OH)
Richmond sits inside the Dayton hiring shadow, not Indianapolis.
Supervisor wages drift eastward from Ohio quickly.
When planning Indiana expansion, the border dynamics matter as much as the in-state dynamics.
Step 5 — Regional Wage Drift
(Clinivise: BCBA Salary Analysis)
Nearby states — including Ohio, Illinois, Michigan, and Kentucky — typically show:
- $80K–$105K median BCBA wages
- Upper ranges hitting ~$110K+ in competitive metros
Why this matters:
- BCBAs cross borders regularly
- Hybrid/telehealth supervision broadens geography
- Wage spikes next door can impact Indiana within months
This is a major hidden risk in counties near OH, MI, IL, and KY.
Step 6 — Analyze Per-Capita Saturation & White Space
(Clinivise: State Comparison + Geographic Analysis)
Indiana’s per-capita certificant density is high — good for access, but it signals:
- Elevated competition
- Labor cost inflation pressure
- Market fragmentation
Contrast that with states like:
- Oregon, at only 23 certificants per 100k — one of the most under-supplied states in the country
- New York, at 28 per 100k
- Washington, at 36 per 100k
If I’m choosing between opening in:
- Indianapolis (dense workforce, faster ramp, more hiring friction)
- Portland, Oregon (workforce shortage, slower ramp, but far higher long-term demand)
…the strategic calculus becomes clear:
Indiana gives you speed; Oregon gives you long-run defensibility.
It’s one of the most overlooked distinctions in expansion planning — you’re not just choosing geography, you’re choosing growth physics.
Step 7 — Understand Provider Saturation at the ZIP-Level
(Clinivise: Provider Finder + HHI)
Clinivise’s Provider Finder shows:
- Providers within 10 miles
- Market concentration (HHI)
- Density per 100 population
- Practice clustering patterns
For operators:
- Fragmented markets → wage wars
- Consolidated markets → slow referral onboarding
- Low-density markets → good access story, harder staffing
This used to require PE-grade analytics.
Now operators can run their own ZIP-level scans in minutes.
Step 8 — Bringing It All Together: A Market Entry Decision Framework
At this point, a COO or investor has a grounded view:
A. Workforce supply — strong RBT numbers, tightening BCBA availability
B. Workforce momentum — Noble, Allen, Hamilton showing shifts
C. Hiring pressure — 547 openings → competitive
D. Labor cost pressure — strong influence from IL, OH, MI, KY
E. Saturation — high-density state → more hiring friction
F. ZIP-level dynamics — reveals over- and under-served corridors
G. Border markets — Chicago, Louisville, Dayton exert strong pull
The core question becomes:
Can I staff and scale a clinic here without supervisory instability or spiraling delivery costs?
That’s the real expansion constraint.
What Comes Next
Everything above is powered only by the public data Clinivise exposes today.
The next leap — and what operators truly need — is integration with:
- reimbursement data
- rate adequacy
- denial patterns
- prior auth friction
- paid vs. allowed variance
- payor stability
- drive-time access
- predictive expansion scoring
A Quick Note on Data Quality — And Why This Matters
Before closing, it’s worth acknowledging an industry truth:
Not all data in this space is equally reliable — especially reimbursement data.
Transparency-in-Coverage (TIC) files are:
- massive
- inconsistently structured
- filled with duplicate or placeholder entries
- often missing provider names or locations
They’re not designed for the questions operators actually need to answer.
And while extremely accurate, claims-derived reimbursement datasets do exist in the market, they are priced at levels accessible only to national payors and the largest ABA providers.
For most ABA providers, the cost puts that type of clarity completely out of reach.
This is why clean workforce, hiring, and saturation data matters so much:
it provides a usable foundation today.
When workforce intelligence converges with real reimbursement intelligence, ABA will finally have:
A true growth underwriting framework for clinical operations.
This Indiana walkthrough shows just how far you can get with workforce and hiring data alone.
The reimbursement layer — once solved — will complete the picture.
Better data isn’t just an analytics problem — it’s an access problem. The clearer our visibility into labor, reimbursement, and saturation dynamics, the more responsibly we can expand care to the families who are still waiting.
👉 Subscribe to the ABA Mission Newsletter for regular insights into ABA strategy, tech platforms, and investment activity.
🔗 Sign up here