When the Hours Don't Match
Part One of MissionViewpoint's series: Can You Explain Your Hours?
ABA providers track what they request, what payors approve, and what they deliver. Can they explain why those numbers change—and whether the evidence supports them?
In October, the Wall Street Journal reported that 69 Arizona Medicaid children who switched ABA providers saw their average weekly billed treatment hours increase from approximately 13 to 24.
Claims data made that comparison possible. But it couldn't independently explain what clinicians recommended, what payors approved, or why treatment intensity changed.
In my October response, ABA Never Built a Common Utilization Benchmark — The WSJ Did, I argued that despite its best efforts, the industry has yet to establish a common framework for understanding treatment utilization.
That gap isn't limited to what outsiders can see. Can ABA providers themselves explain why treatment hours increase or decrease over time, and connect those changes to clinical progress?
Much of the information already exists in clinical, authorization, scheduling, billing, and assessment systems. The question is whether it can be connected into a history that makes sense.
The Same Patient, Different Stories
Consider a patient over four successive authorization periods.
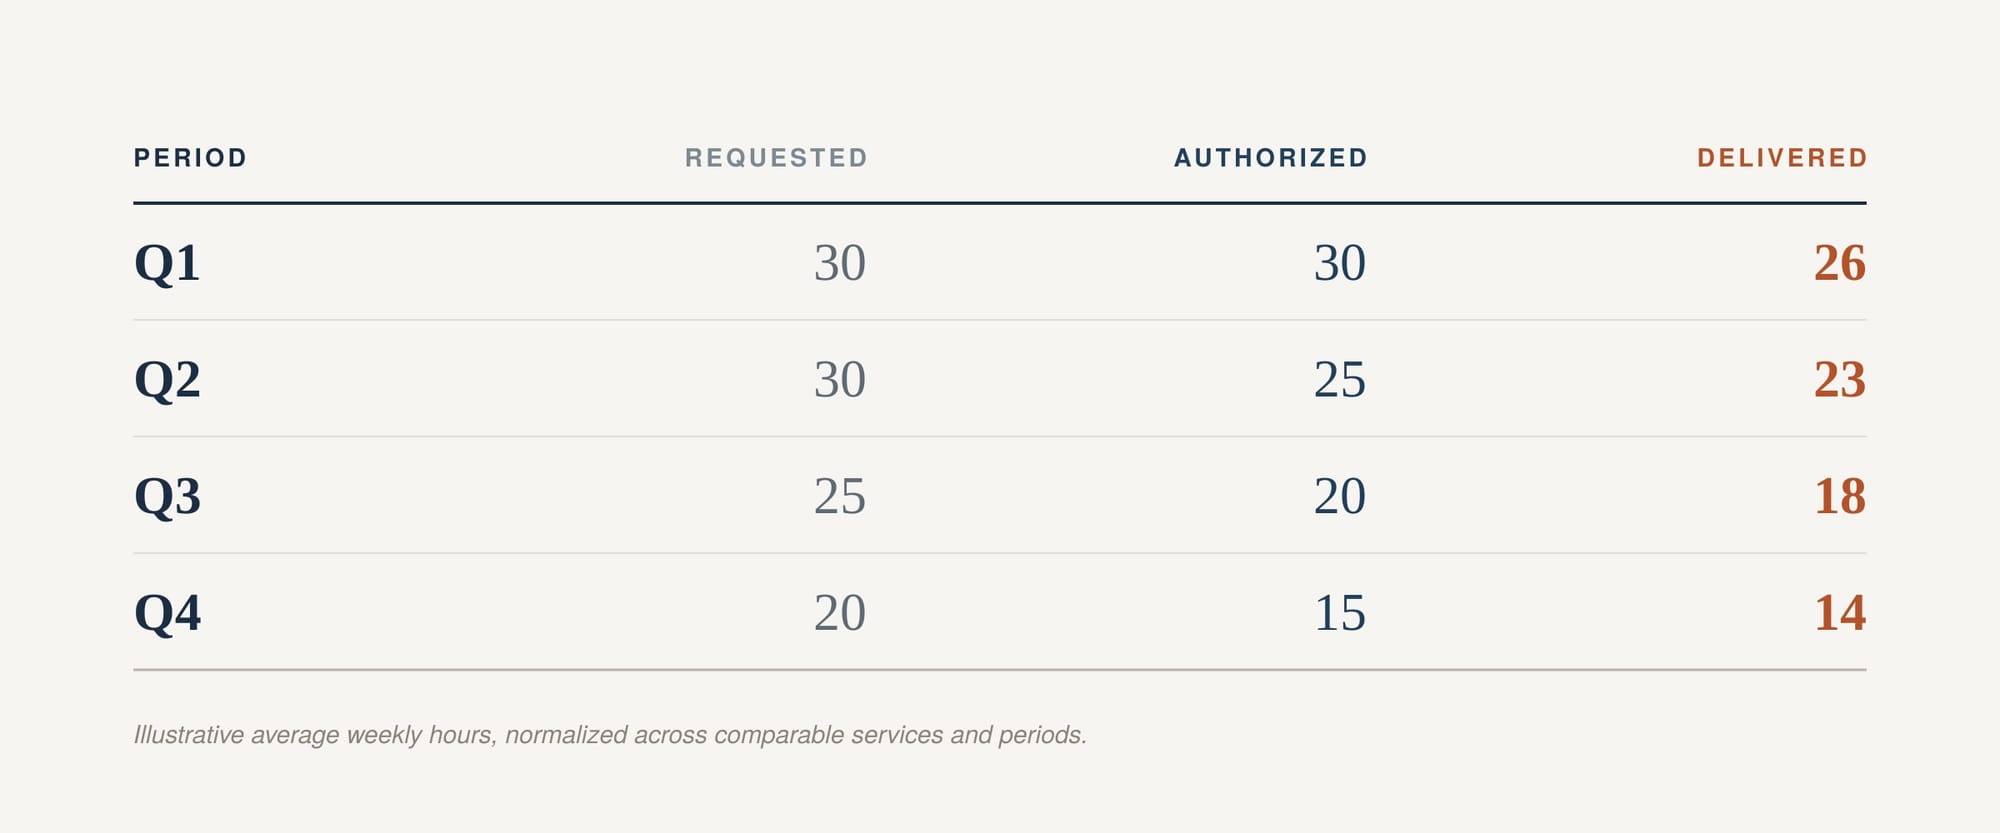
Illustrative average weekly hours, normalized across comparable services and periods.
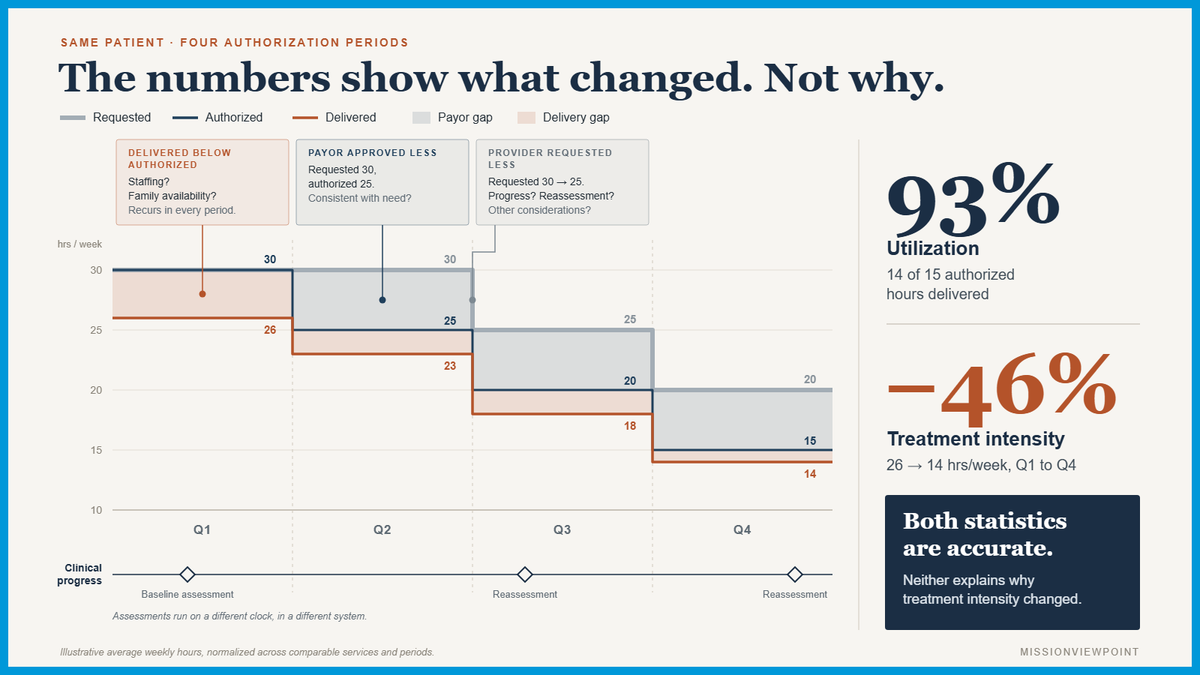
The patient went from receiving 26 hours per week to 14. But that reduction didn't happen for a single reason.
Between Q1 and Q2, the provider requested the same intensity, but the payor approved less. Between Q2 and Q3, the provider requested fewer hours. Throughout all four periods, delivered treatment remained below what was authorized.
Was the reduction in requested hours driven by clinical progress, a reassessment, or another consideration? Did staffing or family availability limit delivery? Did the payor impose restrictions that the clinician believed were inconsistent with the patient's needs?
The numbers show what changed. They don't explain why.
A provider focused on authorization utilization could miss much of the story. Delivering 14 of 15 approved hours represents 93% utilization. By that measure, the provider appears to be performing well. But the same patient received 26 hours per week earlier in the year.
Both numbers are accurate. Neither explains why treatment intensity fell by nearly half.
Now reverse the direction. A patient enters treatment at 15 hours per week. Six months later, the provider recommends 25, the payor approves 25, and the patient receives 24.
Authorization and delivery appear well aligned. But why did the clinical recommendation increase? Was there a reassessment identifying greater need? Had the patient previously received less treatment than recommended? Did a change in provider practices influence the recommendation?
The same connected history should help explain increases as well as reductions. Neither direction establishes clinical appropriateness by itself.
What Gets Lost Between Systems
ABA providers already use software to manage treatment plans, authorizations, schedules, clinical documentation, and billing. Each system or module supports a specific part of the work.
The authorization team needs to know what's approved. Scheduling needs to know what can be delivered. Billing needs accurate records of completed services. Clinicians need current treatment plans and progress information.
But those workflows don't necessarily preserve a readily accessible explanation of how the numbers changed across authorization periods.
A payor may approve fewer hours than requested, with the difference recorded in an authorization note. A clinician may revise a recommendation, with the rationale contained in an updated treatment plan. Staffing constraints may reduce delivery, with the explanation scattered across scheduling and cancellation records.
None of that means the information is necessarily missing. It may simply be difficult to retrieve and connect.
There is also information worth preserving deliberately.
Suppose a clinician recommends 25 hours and the payor approves 15. The clinician may believe the reduction is inconsistent with the patient's assessed needs, even if the provider proceeds under the approved authorization.
That clinical concern could be documented and linked to the authorization decision. As treatment progresses, the organization could revisit the concern alongside subsequent clinical evidence. That evidence may inform a retrospective review, although it cannot by itself prove whether the original decision was appropriate.
And there is another set of records that belongs in this history: clinical progress over time.
Providers may use the Vineland Adaptive Behavior Scales, EarliPoint's developmental assessments, or other standardized and patient-specific measures to track changes in functioning and development. Those measurements may reside outside the practice management system or EHR, and they may be collected at intervals that don't align with authorization periods.
A connected treatment history should preserve assessment dates, relevant results, and links to the underlying clinical records. That would allow providers to examine changes in treatment intensity alongside changes in clinical progress, without assuming one caused the other.
The missing capability isn't necessarily another utilization report. It's a way to preserve the explanations behind changes in treatment intensity and connect them to what happened afterward.
Building the Record Without Starting Over
Providers don't necessarily need a new platform to make this information useful. Much of it already exists in their clinical, authorization, scheduling, and billing systems. The challenge is connecting those records and capturing the explanations that transactions alone cannot provide.
There are three practical approaches:
1) Use the EHR or practice management system you already have. Existing authorization notes, configurable fields, or custom forms may be enough to capture why a clinical recommendation changed, why a payor approved fewer hours, or whether a clinician questioned the decision. Scheduled and delivered hours should come from existing transactions, not additional documentation. The test is whether those explanations can be linked to the relevant records and retrieved later.
2) Connect existing systems through a shared data store. A relatively lightweight database could link authorization, clinical, scheduling, and billing records using patient identifiers, service codes, and effective dates. Where explanations aren't already captured, a new structured field could identify whether a change was driven by clinical reassessment, payor restriction, staffing, family availability, or other factors. A clinician's concern about a payor decision could also be preserved for subsequent review. The data store wouldn't need to duplicate every source record, just maintain the additional information and relationships necessary to reconstruct the history.
3) Extend an existing enterprise data platform. Larger providers with data warehouses may already have much of the infrastructure required. They could incorporate the same explanations and historical relationships into their existing environment, standardizing reporting across clinics, payors, and technology platforms.
Whichever approach a provider chooses, longitudinal clinical measurements belong in the picture. Assessments from Vineland, EarliPoint, or other measurement systems can be linked to the same patient timeline, preserving their dates, results, and clinical context.
The objective isn't to collect more information for its own sake. It's to make the information providers already collect explainable over time—and capture the few missing pieces that make the history meaningful.
The Record Cuts Both Ways
A connected treatment history could help providers explain why payors restricted treatment or why staffing prevented patients from receiving recommended care.
But it could also reveal increases in treatment intensity that aren't supported by a clear change in clinical need, differences in recommendations across comparable patients or clinics, or treatment that continues at the same intensity despite evidence suggesting reassessment is warranted.
Those findings deserve the same scrutiny as reductions imposed by payors.
And there is an uncomfortable business reality. For ABA providers, treatment hours are both a clinical decision and a primary driver of revenue. Better information may support more treatment for some patients and less for others.
An organization that uses data only to defend existing recommendations or recover lost billable hours hasn't solved the problem. It has simply made its existing incentives easier to defend.
The value of a connected history is that it allows providers to examine their own decisions with the same rigor they would expect from a payor reviewing their utilization.
The One-Patient Test
Before investing in another reporting tool, select one patient who has received treatment for at least a year.
Ask your team to show how requested, authorized, and delivered hours changed across that period, and explain the material differences.
Can they retrieve the reasons for clinical changes, payor restrictions, and operational shortfalls? Can they explain increases as well as reductions? Can they identify concerns documented at the time and view those changes alongside longitudinal clinical measurements, whether from Vineland, EarliPoint, or another instrument?
How many systems must they open? How much depends on manually interpreting old documents or asking someone who remembers?
The objective isn't another dashboard. It's establishing whether your organization can explain the treatment history it has already created.
Once that history is connected, a different set of questions becomes possible: What do changes in treatment intensity reveal about clinical progress, access to care, payor behavior, and organizational performance?
That's the subject of Part Two: What the Hours Can't Tell You.
If this analysis is useful, you can subscribe to receive future SCUBA updates and related insights through the MissionViewpoint newsletter.
Prefer LinkedIn? Subscribe here.